

Hello Magento buddies,
Ever wished to see your orders and amounts in a graphical representation?
It is possible in default Magento. So, this is what our today’s post is about.
I will be sharing the steps to Enable Admin Dashboard Charts In Magento 2.
The admin dashboard chart displays the orders and amounts in a chart. This will help show an insightful view of your Magento store’s statistics.
The chart shows the store orders and amounts in accordance with the timeline selected.
So, let us see how we can configure this:
How To Enable Admin Dashboard Charts In Magento 2?
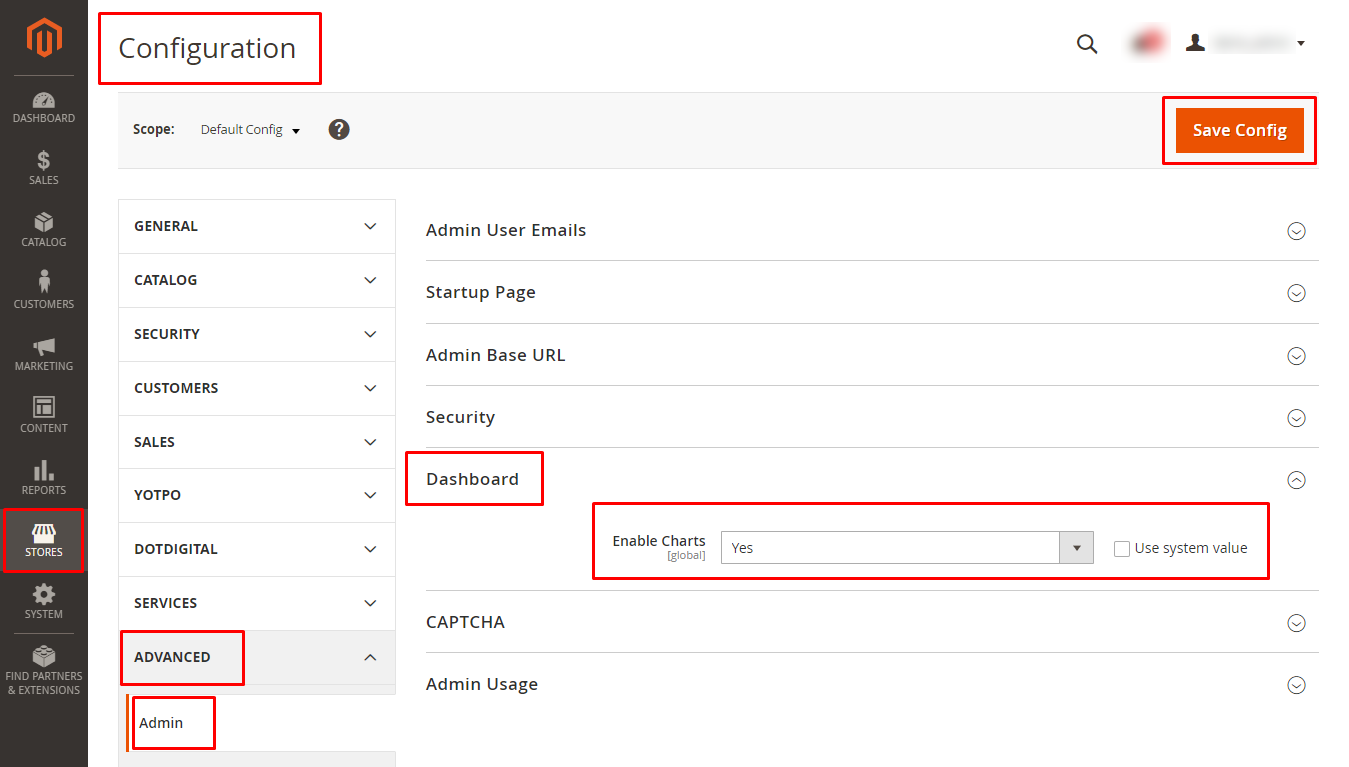
- Sign in to Magento admin.
- Head to Stores → Settings → Configuration.
- After that, Advanced → Admin.
- We will be working in the Dashboard area.
- Set the Enable Charts option to Yes.
- Save Config.
You would be able to see the chart in the admin dashboard. It is also customizable as per the orders and amounts.
Wrap Up!
So that was as easy as a pie!
Configure it and view your store details graphically.
Also, track all the backend activities using Magento 2 Admin Action Log which is performed by various Magento admin users.