India is a developing country, and this development phase has brought a transformative financial wave, largely driven by the Unified Payments Interface, shortly and famously known as UPI. This amazing technology has fundamentally changed the landscape of monetary transactions.
From the day it was introduced until now, UPI has accounted for over 80% of all digital payments countrywide, proving its dominant role in the Indian financial ecosystem.
According to reports, an astounding 14.96 billion transactions were executed via UPI in the recent fiscal year only, amounting to ₹20.60 lakh crores. This unprecedented volume highlights the platform’s efficiency and the increasing adoption of digital payment methods among consumers and businesses alike.
UPI Statistics (Editor’s Choice)
- UPI recorded around 15.04 billion transactions in September 2024, which was 3% higher than the transactions recorded in August 2024.
- The total value of UPI transactions in September 2024 was ₹20.64 lakh crores, which was higher than the transactions amount in August 2024 (₹20.61 lakh crores).
- The value of UPI transactions in September 2024 increased by 42% compared to August 2024, when it increased by 31%.
- According to reports, from August to September 2024, UPI transaction volume increased by 3% and transaction value by 0.15%.
- UPI transactions crossed 100 billion in the financial year 2023-24, totaling 131 billion transactions valued ₹199.89 lakh crores.
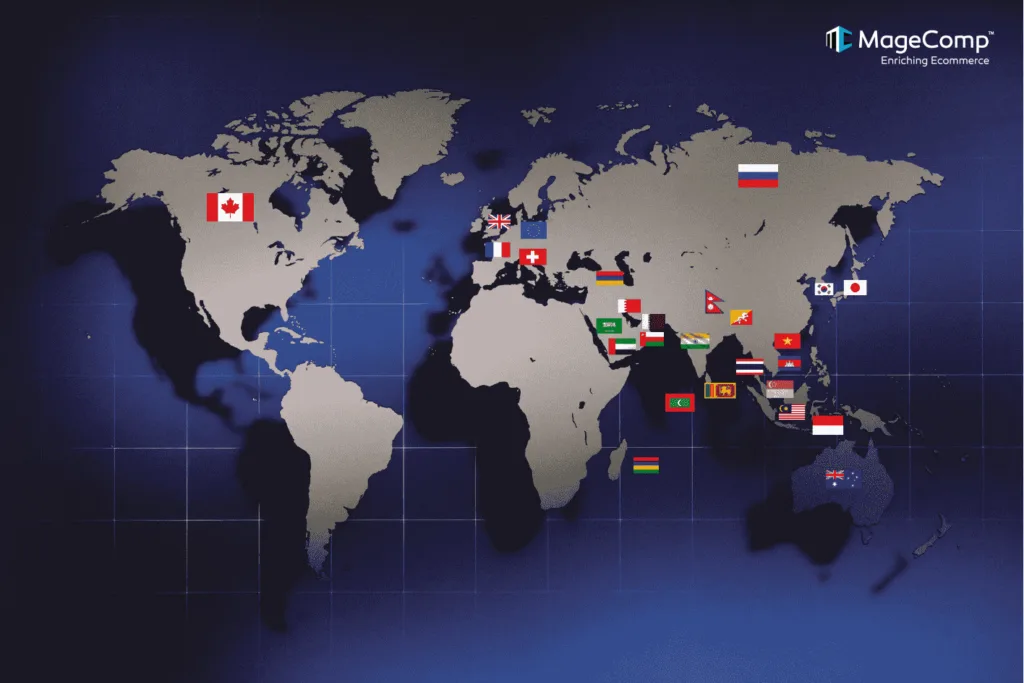
- UPI is now accepted in twelve countries, including Sri Lanka, Nepal, Bhutan, Mauritius, France, and the UAE.
- UPI recorded 16.6 billion transactions in October 2024, with an approximate of 535 million daily transactions.
- As of 2023, approximately 49% of real-time payment transactions were recorded in India.
- As per an estimation, UPI daily transactions are said to reach 1 billion by the end of 2027.
- UPI is gaining up to 6 million new users every month thanks to the integration of RuPay credit cards and its expansion across international markets.
General UPI Statistics
- Over 350 million users in India use UPI.
- UPI records over 14.96 billion transactions every day.
- Over 443 million UPI transactions take place every day.
- More than 10 million transactions are processed every month through UPI lite.
- More than 48.7% of transactions are done via PhonePe.
UPI Usage Statistics
How many people use UPI?
- Since its launch, the number of UPI users has been increasing, and within a couple of years, it exceeded 100 million.
- According to our estimations, UPI has managed to gain 350 million nationwide within 8 years.
- Most people in the country now prefer cashless payments, and citizens in the Asia-Pacific region are eager to adopt new cashless options.
- Approximately 93% of people likely made cashless payments in the past year.
How many UPI transactions take place every day?
- India experienced a boost in daily UPI transactions after the COVID-19 pandemic, crossing 443 million daily UPI transactions.
- As of now, these daily transactions are expected to reach 465 million transactions.
- Daily transactions through UPI have increased significantly over the past few months. In February 2022, there were 240 million daily transactions.
- The RBI governor announced Digital Payments Awareness Week at the RBI headquarters. He mentioned that, as of 2023, the value of these UPI transactions is ₹6.27 lakh crore, a 17% increase compared to the previous year.
- In February 2022, the value of UPI transactions in India was ₹5.36 lakh crore.
- As per the new guidelines issued by NPCI, UPI users can process up to 20 UPI transactions within 24 hours. (Note: these limits can vary as per bank regulations.)
- Popular UPI apps like Paytm, Google Pay, and Amazon Pay UPI handle daily transactions totaling ₹1 lakh ($1,199.50).

How many UPI transactions are processed every month?
- As of August 2023, UPI transactions registered more than 10 billion per month and kept on the rise thereafter. With 15.03 billion transactions, users in India are far ahead in using UPI.
- It was studied that an average of 10067.22 million transactions are reported monthly.
- UPI transactions have risen by 4.103 billion in contrast to 2022 and by 7.19 billion for the year 2021.
- NPCI anticipates that UPI transactions could reach as many as 20 billion monthly in the next 18 to 24 months.
- Some public sector banks and some licensed private banks have imposed limits on monthly UPI transactions.
- IDFC Bank has a monthly UPI transaction limit of INR 30 lakhs, while SBI does not set any limit. Until all the banks harmonize their abbreviated UPI transaction limits under RBI regulation, numerous banks will have many different limits for the transactions. Here is a list of popular Indian banks and their set UPI limits:
| Bank of Baroda | ₹25,000 |
| HDFC | ₹100,000 |
| ICICI Bank | ₹100,000 |
| IDBI Bank | ₹100,000 |
| IDFC | ₹100,000 |
| India Post Payment Bank | ₹25,000 |
| Kotak Mahindra Bank | ₹100,000 |
| United Bank of India | ₹25,000 |
| Punjab National Bank | ₹25,000 |
In how many countries is UPI accepted?
- You might be surprised to know that UPI is not limited to India only. There are 27 countries worldwide where UPI is accepted.
- The government of Sri Lanka launched UPI payment acceptance under the terms of the 2021 agreement.
- France, Singapore, and Sri Lanka have adopted the payment system based on UPI.
- The Reserve Bank of India (RBI) collaborated with the Central Bank of the UAE to establish a memorandum of understanding (MoU) for payment system and messaging system interlinkage. Through this agreement, the UAE successfully connected with UPI payment services operated by India.
- The National Payments Corporation of India (NPCI) has scheduled discussions with multiple national entities, including the USA and European countries, as well as nations throughout West Asia, for the development of UPI services.
UPI Lite Statistics
- UPI Lite has become the national buzzword for enabling swift payments of small amounts through a one-step process. Users who employ UPI Lite can conduct transactions worth up to ₹200 with a single touch.
- The Reserve Bank of India raised UPI Lite transaction limits from ₹200 to ₹500 to address the expanding popularity and transforming impact of this service in daily life.
- Out of all payment platforms, Paytm was the first platform to introduce the UPI Lite for miscellaneous (small-amount) transactions easily.
- Over 63% of UPI Lite payments are done via Paytm QR codes from the Paytm App.
- Paytm Payments Bank has recorded over 50 million UPI Lite transactions till now.
- Users do not need to enter any PIN to process small transactions that run on a similar size to a UPI ticket; this has helped the platform achieve a 99.9% success rate.
Which bank has the highest UPI share?
- State Bank of India dominates the UPI market through its more than 4 billion transactions. HDFC Bank Ltd, together with Bank of Baroda and Union Bank of Indi, joined the State Bank of India in creating the list of banks with the most UPI transactions.
- Total UPI operations expanded by about 200 million during the same month as the preceding period.
- The United Payments Interface transactions processed by the States Bank of India reached 1.97 billion in October 2022.
- The UPI transactions processed by the State Bank Of India through monthly operations grew by one billion during a year.
- HDFC Bank holds the second position, while Bank of Baroda maintains the third spot in terms of total transaction volume, which stands at 1 billion and 748 million, respectively.
Here is the list of banks and their total number of transactions recorded within a year:
| Bank Name | Avg no. of transactions |
| State Bank of India | 4052 million |
| HDFC Bank | 1270 million |
| Bank of Baroda | 985 million |
| Union Bank of India | 941 million |
| Punjab National Bank | 835 million |
| Kotak Mahindra Bank | 772 million |
| Axis Bank Ltd | 730 million |
| Canara Bank | 722 million |
| ICICI Bank | 648 million |
| Bank of India | 478 million |
UPIs Share of online payment apps
- A few years ago, Paytm held the leading position in its market sector. Since the introduction of PhonePe and Google Pay, Paytm’s platform status has shifted to the third position.
- Please find below information about India’s UPI payments market, where PhonePe, along with Google Pay and Paytm, held the leading positions.
- The value of UPI transactions through the National Payments Corporation of India (NPCI) showed the three leading applications gathered almost 95% of the total amount.
- Research findings indicate that BHIM and Amazon Pay usage rates expanded throughout the most recent months compared to years before.
PhonePe Statistics
- The Indian user base prefers PhonePe over all the UPI applications currently available. UPI users prefer PhonePe to any other payment platform since it accounts for half of all transactions through this system.
- In the financial year 2023, PhonePe generated INR 2,914 Crores in consolidated revenue, which was a 77% increase from the previous year. The financial year 2022 brought in revenue totaling INR 1,646 Crores for PhonePe.
- PhonePe has become the payment method for approximately one-quarter of all Indian users. The business has digitized more than 36 million traditional offline vendors spread throughout all Indian geographic areas from Tier 2 to beyond. The payment operation extends to all 99 percent of Indian postal code areas.
Google Pay Statistics
- The research established that Google Pay gained acceptance from more than 50% of Uber users, with 63% of these users based in locations beyond the top 8 metropolitan cities of India.
- The number of Google Pay users increased by 71 million during 2019. Research indicates that GPay will welcome an additional 101 million users this current year.
- Google Pay remains in third place for mobile payment applications among American users, at 25.3 million. Google Pay maintains a total of 67 million active users who operate from the Indian marketplace.
- Worldwide, 2,197 companies utilize Google Pay for online transaction capabilities. Employees, together with employers, choose the application because they obtain complete service functions through one system.
- The use of Google Pay for store payments reaches 83% of Indian consumers, yet 79% of Indian people rely on it for online transactions.
| Country | Google Pay used for other usage | Google Pay used for online payments |
| India | 83% | 79% |
| United States | 37% | 32% |
| Poland | 34% | 39% |
| Finland | 32% | 29% |
| Germany | 31% | 16% |
| Italy | 30% | 18% |
| Switzerland | 29% | 27% |
| France | 29% | 15% |
| United Kingdom | 28% | 23% |

Paytm Statistics
- Paytm registered a 38% growth in the number of monthly transacting users in 2022-2023. We expect that the number will soon touch the 101 million mark.
- This is compared to the previous year’s increase of 37% when Paytm had about 61 million Monthly Transacting Users in the fiscal year 2022.
- Further, in a letter to the shareholders, Paytm CEO Vijay Shekhar Sharma said they expect 500 million payment users and 102 million merchants soon in the upcoming years.
- Meanwhile, Payments revenue for the financial year 2023 totaled ₹4,930 crores.
- This was a growth of 58% compared with that for 2021.
- In FY 2023, payments made up 62% of total revenues for Paytm.
- Compared to 207.3 million in June 2022, this means payments through the Paytm Payments Bank rose by nearly 200 million in a year.
| Month | Transactions Recorded via Paytm |
| December 2022 | 366 million |
| January 2023 | 387.1 million |
| February 2023 | 391.7 million |
| March 2023 | 405.3 million |
| April 2023 | 404.8 million |
| May 2023 | 425.5million |
| June 2023 | 407.9 million |
BHIM Pay Statistics
- BHIM Pay is a UPI platform launched by the NPCI, which is available in 13 different Indian languages, including English.
- Approximately 22.9 million monthly transactions were recorded via BHIM Pay in June 2023, which was more than the transactions recorded in 2022 (22.5 million). This showcased an increase of 0.4 million transactions over a year.
- As of June 2023, BHIM Pay recorded transactions worth ₹72 billion, which was less than its previous month, ₹75.17 billion.
Additional UPI Statistics
- As per government records, UPI fraud had 84,274 reported cases in 2021-22 and 77,299 cases in 2020-21.
- Closely connected to online banking, almost 50% of the recorded financial fraud cases were from January 2020 through June 2023.
- Between January 2020 and June 2023, financial fraud made up 75% of cyber crimes in India.
- Almost 50% of such financial cyber crime cases revolve around UPI payment and Internet banking.
- ₹1000 is recorded as one of the most common amounts sent to a contact.
- The average spending of a PhonePe user increased by 35% from Sunday to Monday.
- Over 37% of all UPI transactions happen after 6 p.m.
Bottom Line
UPI has shown exponential growth in India, with more than 350 million users and 443 million transactions each day. It is processing almost 15 billion transactions a month, with PhonePe having a market share of 48.3%.
The growing level of acceptance for the UPI system has expanded from the Indian continent to now 27 nations globally, encouraging innovations like UPI Lite.
Fraud is a concern, yet the near-omnipresence of UPI makes it a game-changer for digital payments when it comes to convenience in India, accounting for over 80 percent of digital transactions.

Sources
[Wikipedia, Times of India, Forbes, European Payments Council, Live Mint, RazorPay, NPCI, Cashfree, Economic Times, PhonePe, PlayToday]
Other Statistics Blogs
80+ Unbelievable Facts and Stats About ChatGPT
Jaw-Dropping Google Search Statistics and Facts
Content Management System (CMS) Statistics You Need to Know
35+ Squarespace Statistics for 2025: Fascinating Facts & Figures
30+ Google Analytics Statistics & Usage
100+ Artificial Intelligence Statistics That Will Blow Your Mind – MageComp Edition
70+ Email Marketing Statistics that You Should Know – A MageComp Report
Magento Statistics – Market Share, Usage and Revenue Growth
WooCommerce Statistics and Trends
Wix Statistics – Market Share & Usage – A MageComp Report
Shopify App Store Statistics You Need to Know – A MageComp Report
Instagram Threads’ Statistics: Impact on Social Media Trends
Unbelievable Bing Statistics – Revenue, Usage and Market Share