Hello Magento buddies,
Ever wished to see your orders and amounts in a graphical representation?
It is possible in default Magento. So, this is what our today’s post is about.
I will be sharing the steps to Enable Admin Dashboard Charts In Magento 2.
The admin dashboard chart displays the orders and amounts in a chart. This will help show an insightful view of your Magento store’s statistics.
The chart shows the store orders and amounts in accordance with the timeline selected.
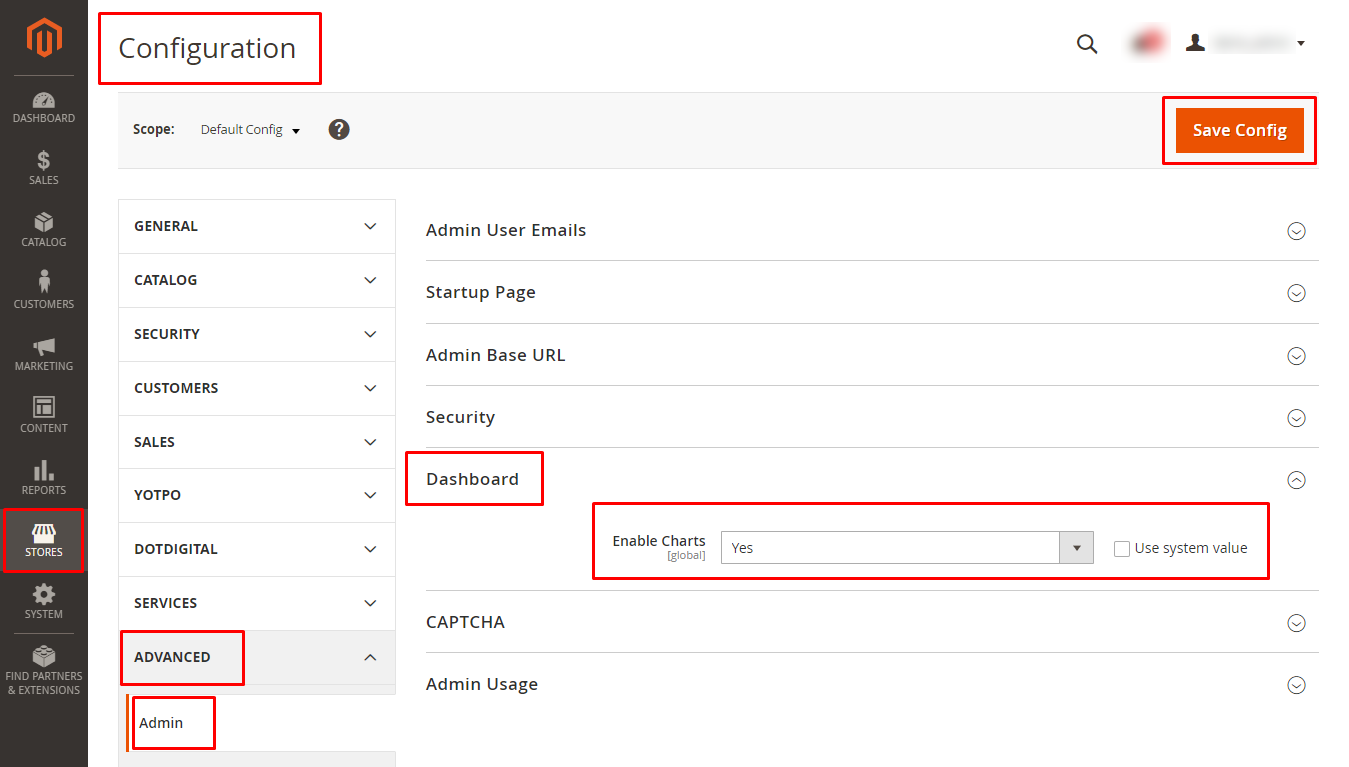
So, let us see how we can configure this:
You would be able to see the chart in the admin dashboard. It is also customizable as per the orders and amounts.
So that was as easy as a pie!
Configure it and view your store details graphically.
Also, track all the backend activities using Magento 2 Admin Action Log which is performed by various Magento admin users.
E-commerce has transformed the way consumers shop for products and services and interact with businesses.…
The e-commerce world is constantly in flux. New tech and strategies emerge daily to help…
Hello Magento Friends, In today’s blog, we will discuss adding a header and footer to…
Hello React Native Friends, Building a visually appealing and responsive mobile app is crucial in…
We're thrilled to announce the release of Hyvä Themes 1.3.6 and 1.3.7! These latest updates…
Your e-commerce platform is surging - orders are rolling in, traffic spikes are becoming the…